S100 - Compact Wide-Range Spectrometer
|
| ||||||||||||||||||||||||||||||||||||||||||||||||||||||||||||||||||||||||||||||||||||
S100 is a basic wide-range spectrometer that is hard to manage without in any scientific lab, at the educational process, and even in field conditions.
2) antiblooming is a sensor feature eliminating charge overflow from exposed pixels to surrounding pixels. 3) the S8378-512Q linear image sensor provides possibility of control over sensitivity mode: high (HS) or low (LS). 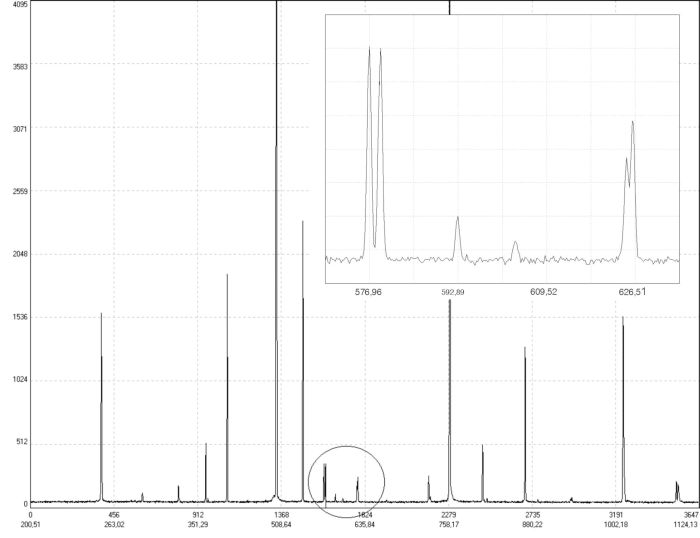 Mercury spectrum acquired with the S100-3648 Linear image sensors TCD 1304AP and TCD 1205D of Toshiba installed in the S100-3648 and S100-2048 feature high sensitivity; large quantity of relatively narrow sensor pixels ensures high resolution and precise wavelength detection. However, when recording wide-band spectra with the S100-3648 and S100-2048, spectrum modulation is observed (see below an incandescent lamp spectrum acquired with the S100-3648), thus limiting to some extent their application in spectrometry. The software allows the user to enter correction of recorded signal intensity in a selected spectral range. The manufacturer does not perform the intensity correction. Linear image sensor S8378-1024 installed in the S100-1024 provides excellent linearity, wide dynamic range and complete absence of spectrum modulation (see an incandescent lamp spectrum recorded with the S100-1024). However, it is characterized by relatively lower sensitivity and due to a wider pixel slightly loses in sense of resolution to devices based on Toshiba arrays. 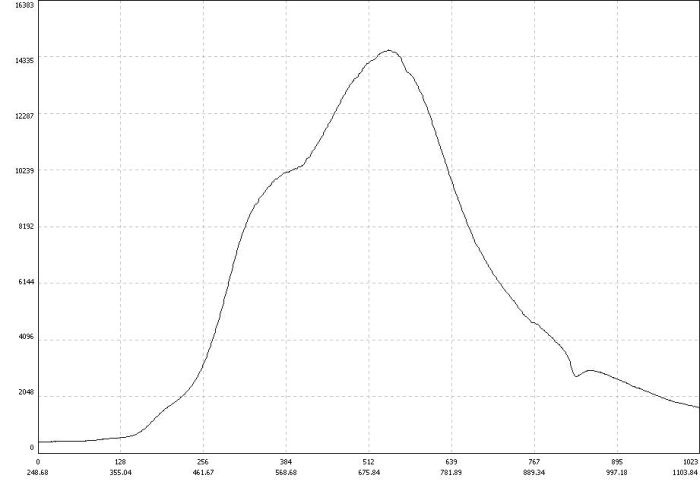 Incandescent lamp spectrum acquired with the S100-1024 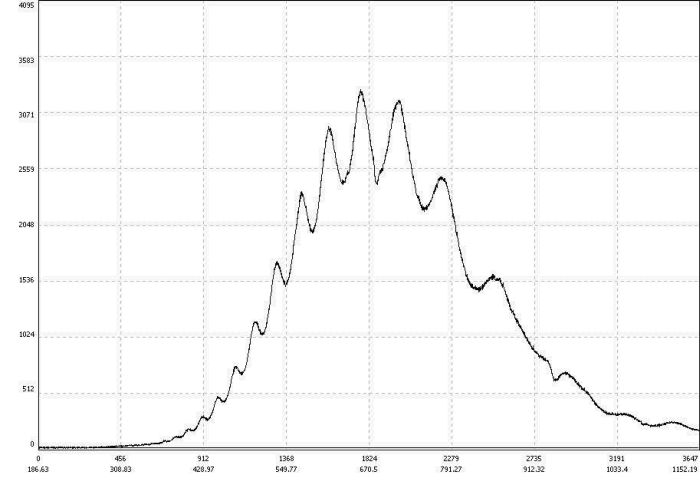 Incandescent lamp spectrum acquired with the S100-1024 | |||||||||||||||||||||||||||||||||||||||||||||||||||||||||||||||||||||||||||||||||||||

| ||||||||||||||||||||||||||||||||||||||||||||||||||||||||||||||||||||||||||||||||||||||||
|
Compact Wide-Range Spectrometer |