S100 is a basic wide-range spectrometer that is hard to manage without in any scientific lab, at the educational process, and even in field conditions.
Use of original concave diffraction grating makes the S100 a unique device which allows concurrently get high-resolution of 1 nm within extremely wide spectral range – from 190 to 1100 nm.
Spectrometer S100 is extremely easy and convenient in use: it is calibrated by the manufacturer, does not contain any movable elements, is controlled and powered from the computer via Full-Speed USB interface. Analyzed light is input either through a quartz optical fiber or directly hit the input slit. Upon your request the S100 may be supplied with a filter separating high spectrum orders.
| Model
| S100-3648 |
S100-2048 |
S100-1024 |
| SPECTROGRAPH |
| Grating, l/mm (average) |
300 |
| Reciprocal dispersion (average), nm/mm |
38.28 |
| F/Number |
6 |
| Focal length, mm |
99 |
| Spectral range, nm |
190-1100 |
200-1100 |
200-1050 |
| Spectral resolution (average), nm |
1.0 |
1.5 |
2.0 |
| LINEAR IMAGE SENSOR |
TCD 1304AP, 3648 pixels, size 8µm x 0.2 mm |
TCD 1205D, 2048 pixels, size 14µm x 0.2 mm |
S8378-1012, 1024 pixels, size 25µm x 0.5 mm |
| Min. exposure time, msec |
7.3 |
4.1 |
2.0 |
| Max. exposure time, sec1) |
0.5 |
4.0 |
5.0 |
| Max. S/N for 1 scan |
400 : 1 |
400 : 1 |
1000 : 1 |
| Antiblooming2) |
no |
yes |
yes |
| Dynamic range |
900 : 1 |
1000 : 1 |
3500 : 1 |
| Photo sensitivity, V/luxsec3) |
160 |
80 |
22 (HS), 4.4 (LS) |
| Readout noise, ADC counts3) |
18 |
14 |
16 (HS), 4.4 (LS) |
| ADC resolution |
14 bit, 16384 counts |
| Synchronization |
internal, external |
| Computer interface |
Full-Speed USB |
| Optical input |
UV Optical Fiber dia 0.6 (0.4)mm, 1m long SMA-905 connector |
| Dimensions, weight |
66 x 86 x 146 mm, 750 g | 1) max. exposure time is the time when the dark signal reaches 10% of the dynamic range at +250С ambient.
2) antiblooming is a sensor feature eliminating charge overflow from exposed pixels to surrounding pixels.
3) the S8378-512Q linear image sensor provides possibility of control over sensitivity mode: high (HS) or low (LS).
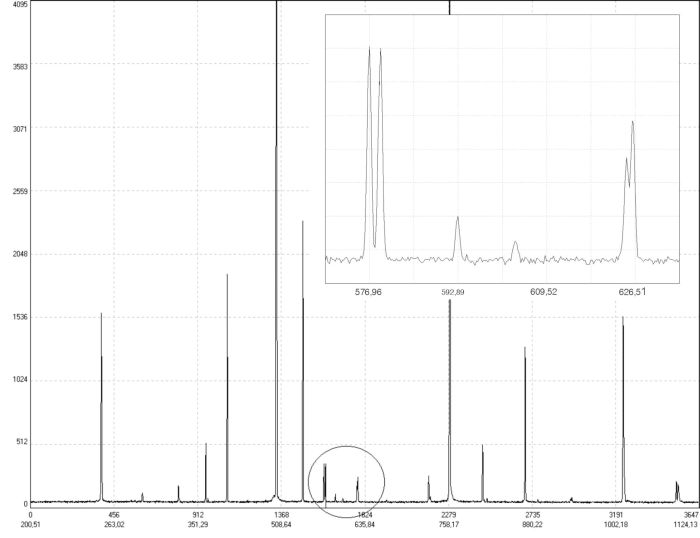
Mercury spectrum acquired with the S100-3648
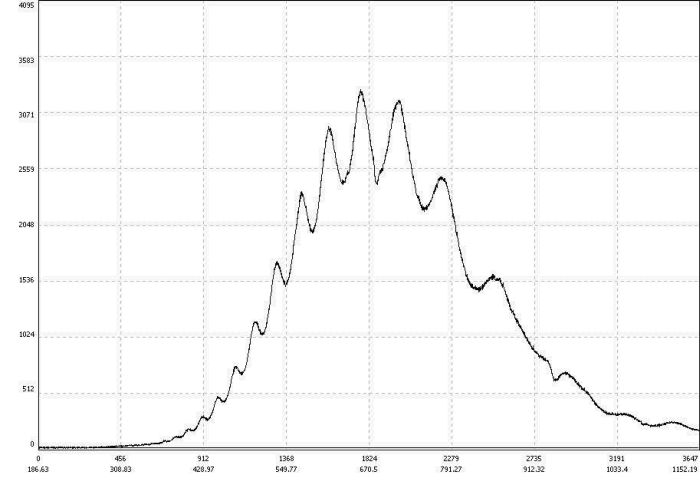
Linear image sensors TCD 1304AP and TCD 1205D of Toshiba installed in the S100-3648 and S100-2048 feature high sensitivity; large quantity of relatively narrow sensor pixels ensures high resolution and precise wavelength detection. However, when recording wide-band spectra with the S100-3648 and S100-2048, spectrum modulation is observed (see below an incandescent lamp spectrum acquired with the S100-3648), thus limiting to some extent their application in spectrometry. The software allows the user to enter correction of recorded signal intensity in a selected spectral range. The manufacturer does not perform the intensity correction.
Linear image sensor S8378-1024 installed in the S100-1024 provides excellent linearity, wide dynamic range and complete absence of spectrum modulation (see an incandescent lamp spectrum recorded with the S100-1024). However, it is characterized by relatively lower sensitivity and due to a wider pixel slightly loses in sense of resolution to devices based on Toshiba arrays.
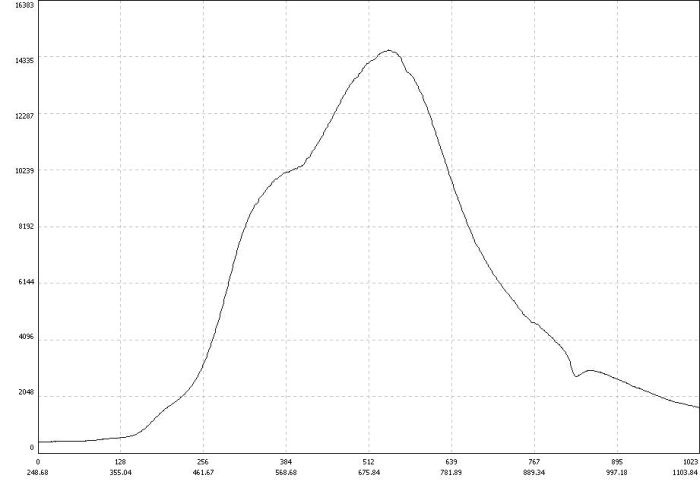
Incandescent lamp spectrum acquired with the S100-1024
Incandescent lamp spectrum acquired with the S100-1024
|


