|
The technique of Time Correlated Single Photon Counting (TCSPC) has been developed and introduced more then 25 years ago. The technique is now widely accepted to be the most sensitive fluorescence detection technique with the inherent temporal resolution required for fluorescence decays.
The advent of sub-nanosecond and picosecond pulsed Diode Pumped Solid State Lasers (DPSSL) with appropriate wavelengths, the availability of suitable detectors of sufficiently fast response time, and modern timing electronics that incorporate the complex acquisition technique into one PCI computer board makes it possible to design a very compact Fluorescence Lifetime Measurement Systems for the use in biological environments, medicine, chemical technology semiconductor’s nanotechnology, advanced optics materials technology, etc.
Fluorescence Lifetime Spectrometer Scheme
Laser: STA-01SH
LD: laser driver
BS: beam splitter
PD: start pulse p-i-n photodiode
PSU: universal multichanal power supply (PA PMT, USB SMD, PD)
Att: attenuator
USB SMD: two-axis stepper motor controller 8SMC-USBh-B2-2
M1: motorized flip-mirror - 8MR174-11+ 5MBM22SP-1
M2: mirror @ 5MBM23-05
L1, L2: focusing lenses @ XYZ translate stage
S@H: sample holder @ XYZ translate stage
Condenser: achromatic condenser of detected emission
FN: Notch filter (531 nm)
Monochromator
PMT: single photon detector
PA: preamplifier of PMT
TEC: Thermo Electrical cooler of PMT
HVS: High Voltage for PMT
PC with PCI TCSP – acquisition system on the base of PC
CCD(USB)
Applications
-
Biotechnology and Biomedicine science
-
Semiconductor science and technology
-
Laser materials and advanced optics materials investigation
-
Environment protection
Possible development
Software
-
Time resolved spectra of fluorescence (or plasma emission)
-
Spatial resolved fluorescence lifetime measurements (Lifetime Mapping)
-
3D plotting of data and time/wavelength axes crossection displaying
-
Emission decay kinetics deconvolution
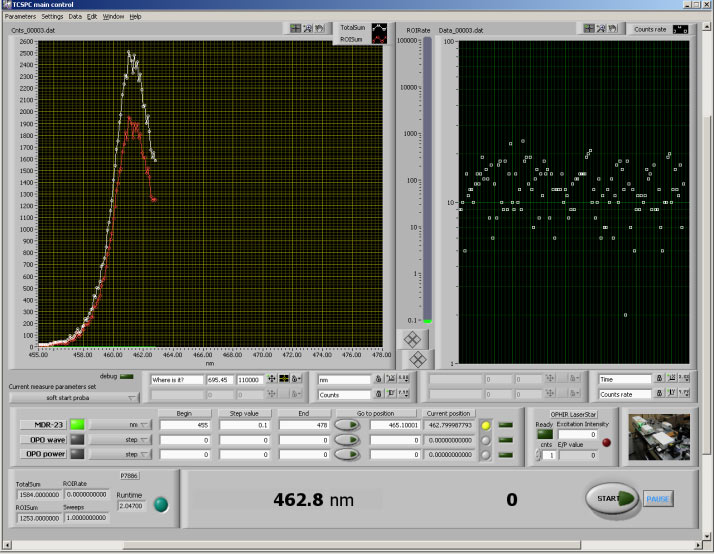
Software for time-resolved PL and PLE spectroscopy is aloud to provide an acquisition and visualization of experimental data . 5 main measurements regime are available:
- decay kinetic at definite parameters of the detector (wavelength /photon energy) and excitation source(wavelength /photon energy and intensity)
- decay kinetic at scan on detector wavelength (energy), when excitation wavelength (energy) and intensity has install
- decay kinetic at scan on excitation wavelength (energy) when detector wavelength (energy) and intensity has install
- decay kinetic at scan on excitation intensity when detector wavelength (energy) and excitation wavelength (energy) has install
- CW PL /PLE spectra in photon counting mode During the scan average intensity of excitation can be measured. 2 windows Real Time Display (RTD) indicate kinetic accumulation process (left window) and integral spectrum of PL (PLE, I-dependence) – right window.
|